Dumbbell Plot
The Dumbbell Plot is a data visualization chart that is used to compare two sets of data with a common variable. It is also called a connected dot plot or a dumbbell dot plot because of its shape, which resembles two dumbbells connected by a line.

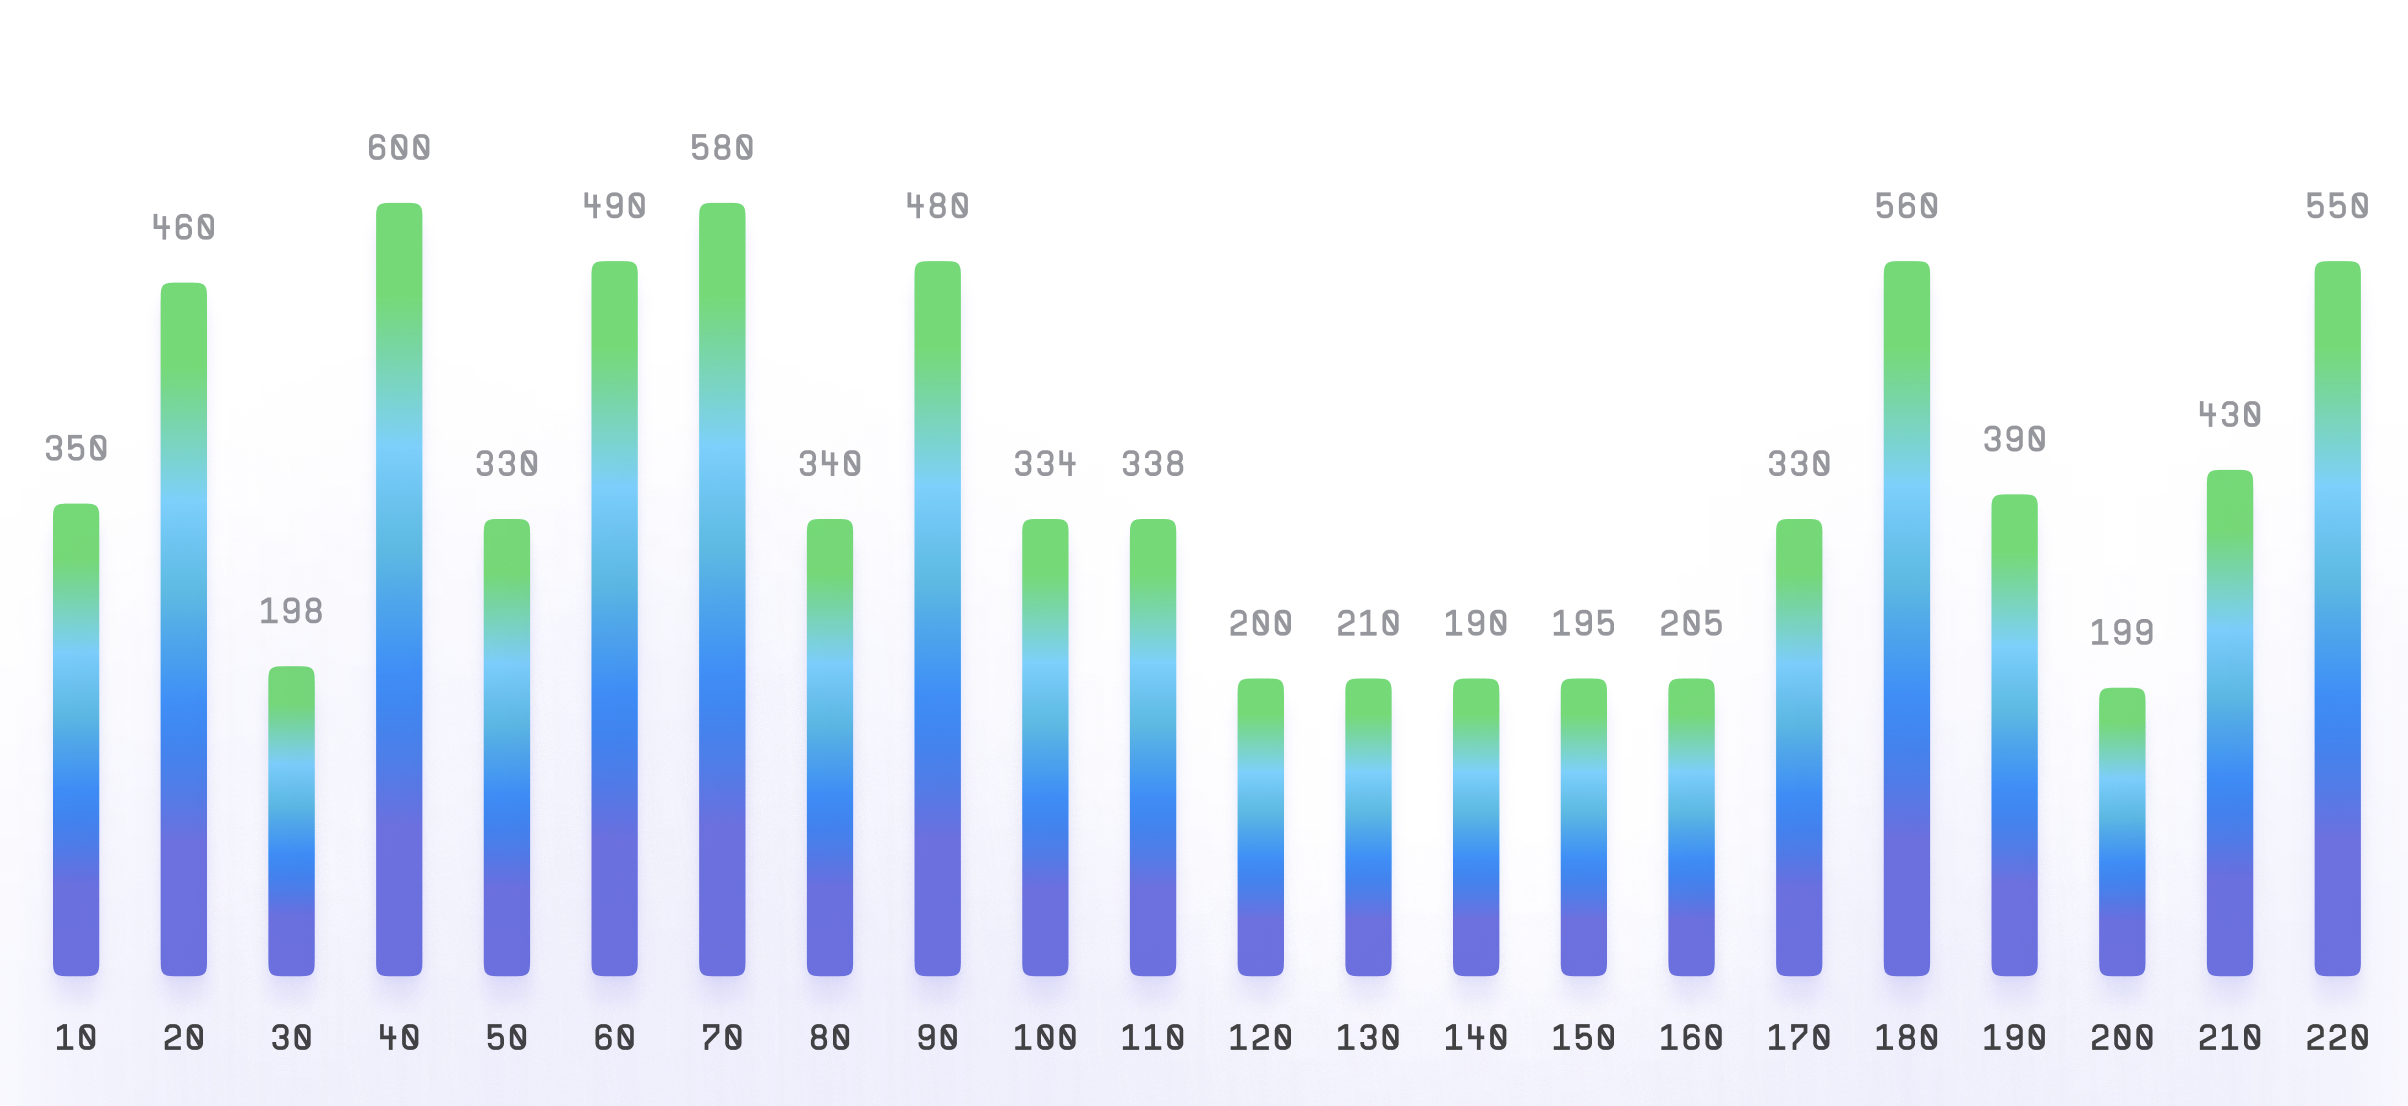
Plotting
To construct a Dumbbell Plot, you start by plotting two sets of data on a horizontal axis.
Each set of data should have its own vertical axis.
Then, you connect the two data points for each set with a line to create the dumbbell shape.
Summary
The chart is particularly useful when the difference between the two sets of data is small or the sample size is small.
One advantage of the Dumbbell Plot is that it allows for easy comparison of the two sets of data.
The connecting line draws attention to the difference between the two data points and makes it easy to see which set is larger or smaller.
Additionally, the chart is easy to interpret and visually appealing.
Overall, the Dumbbell Plot is a useful tool for visualizing the difference between two sets of data with a common variable.
It is easy to construct and interpret, making it a popular choice for data visualization.