Funnel Chart
Funnel Chart is a data visualization chart that is used to show the stages of a process or sales pipeline. It is often used to track the progress of leads or customers through different stages of a sales funnel.
Plotting
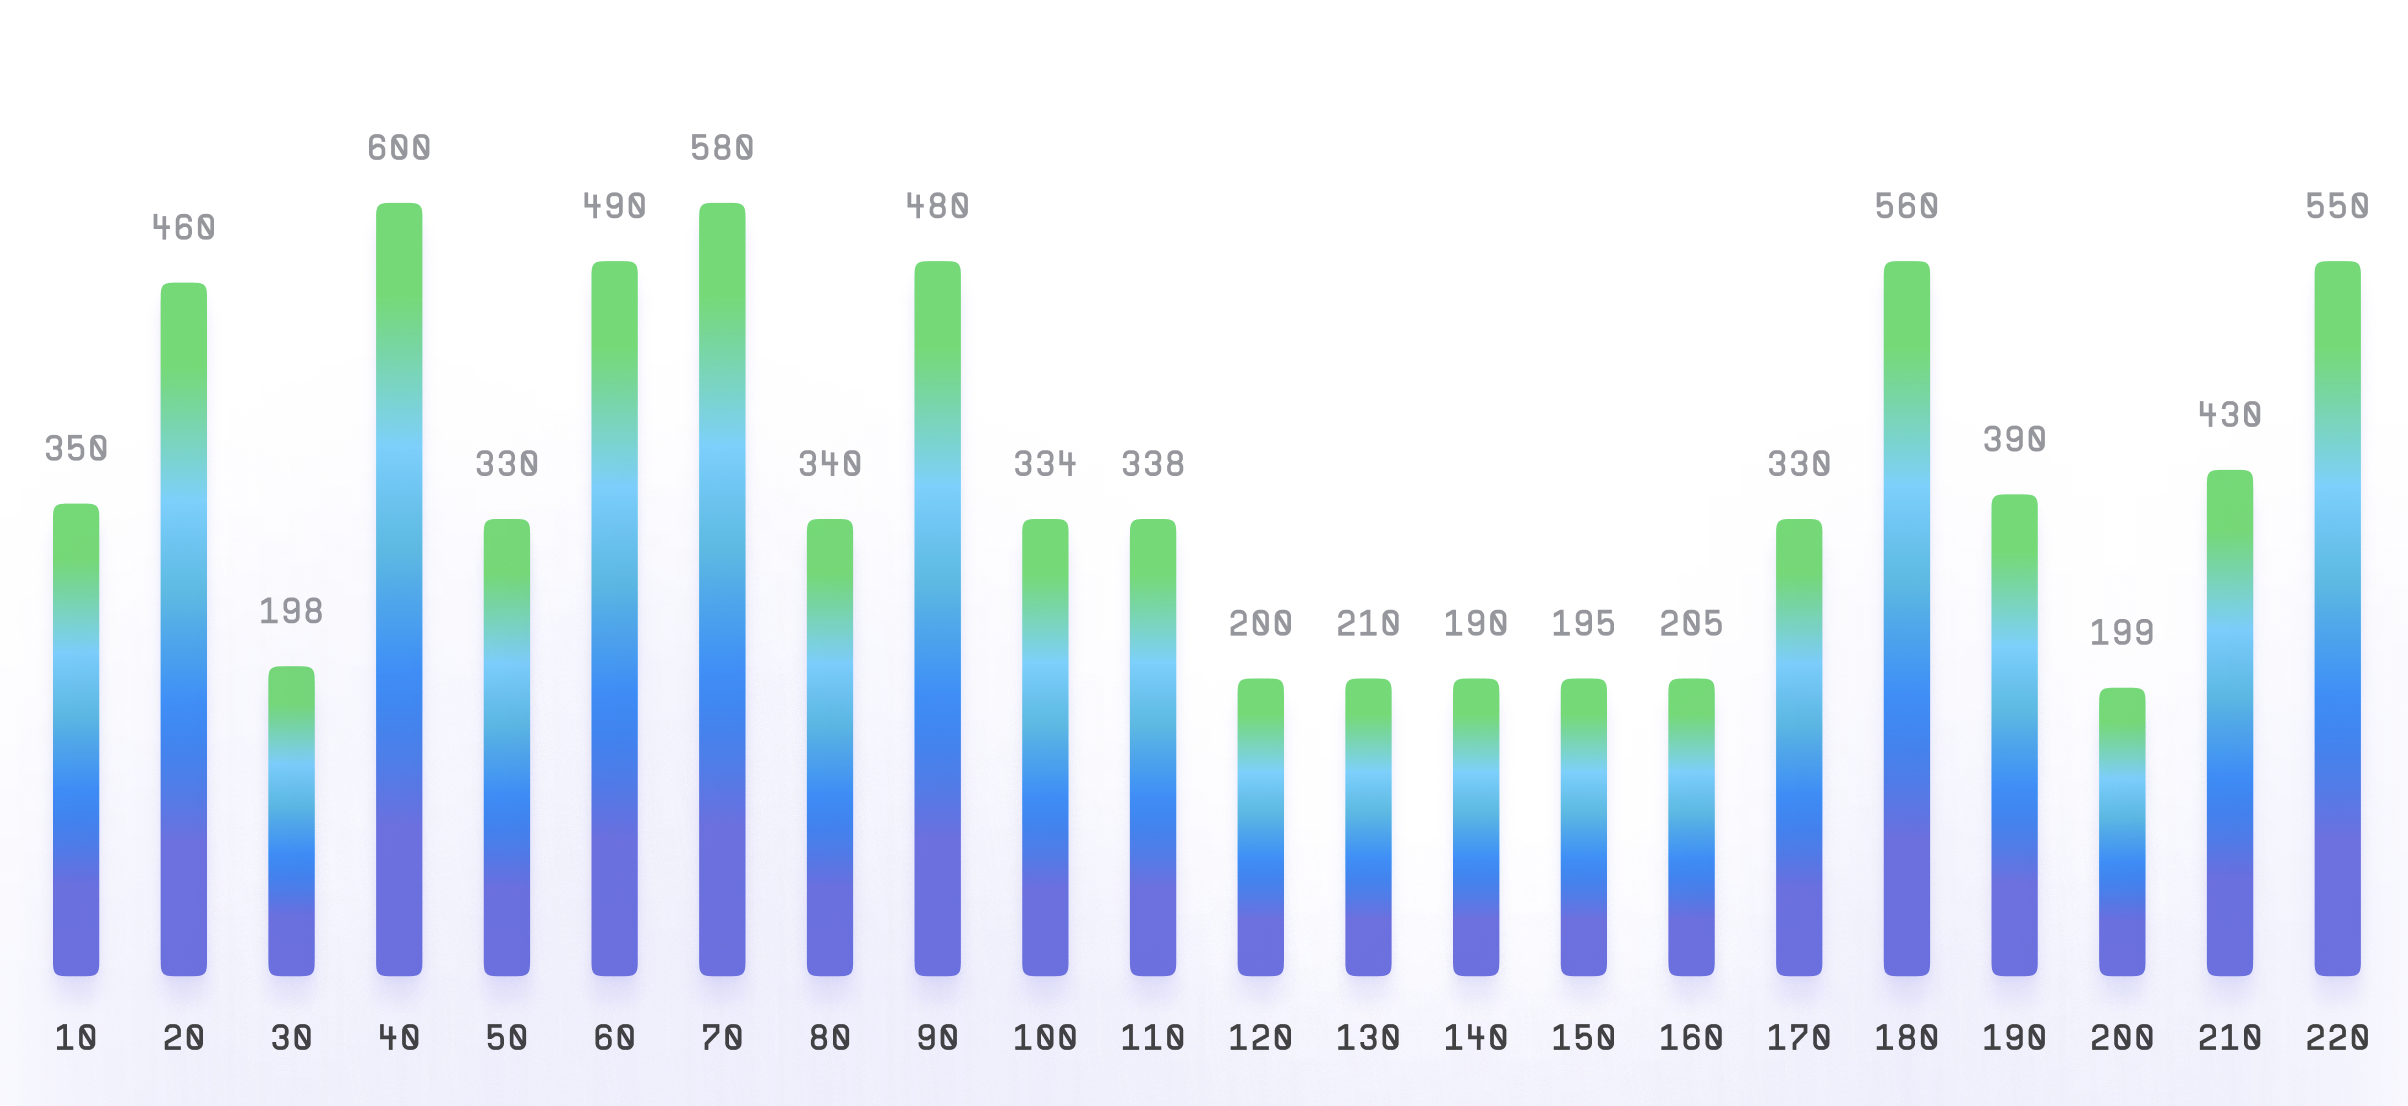
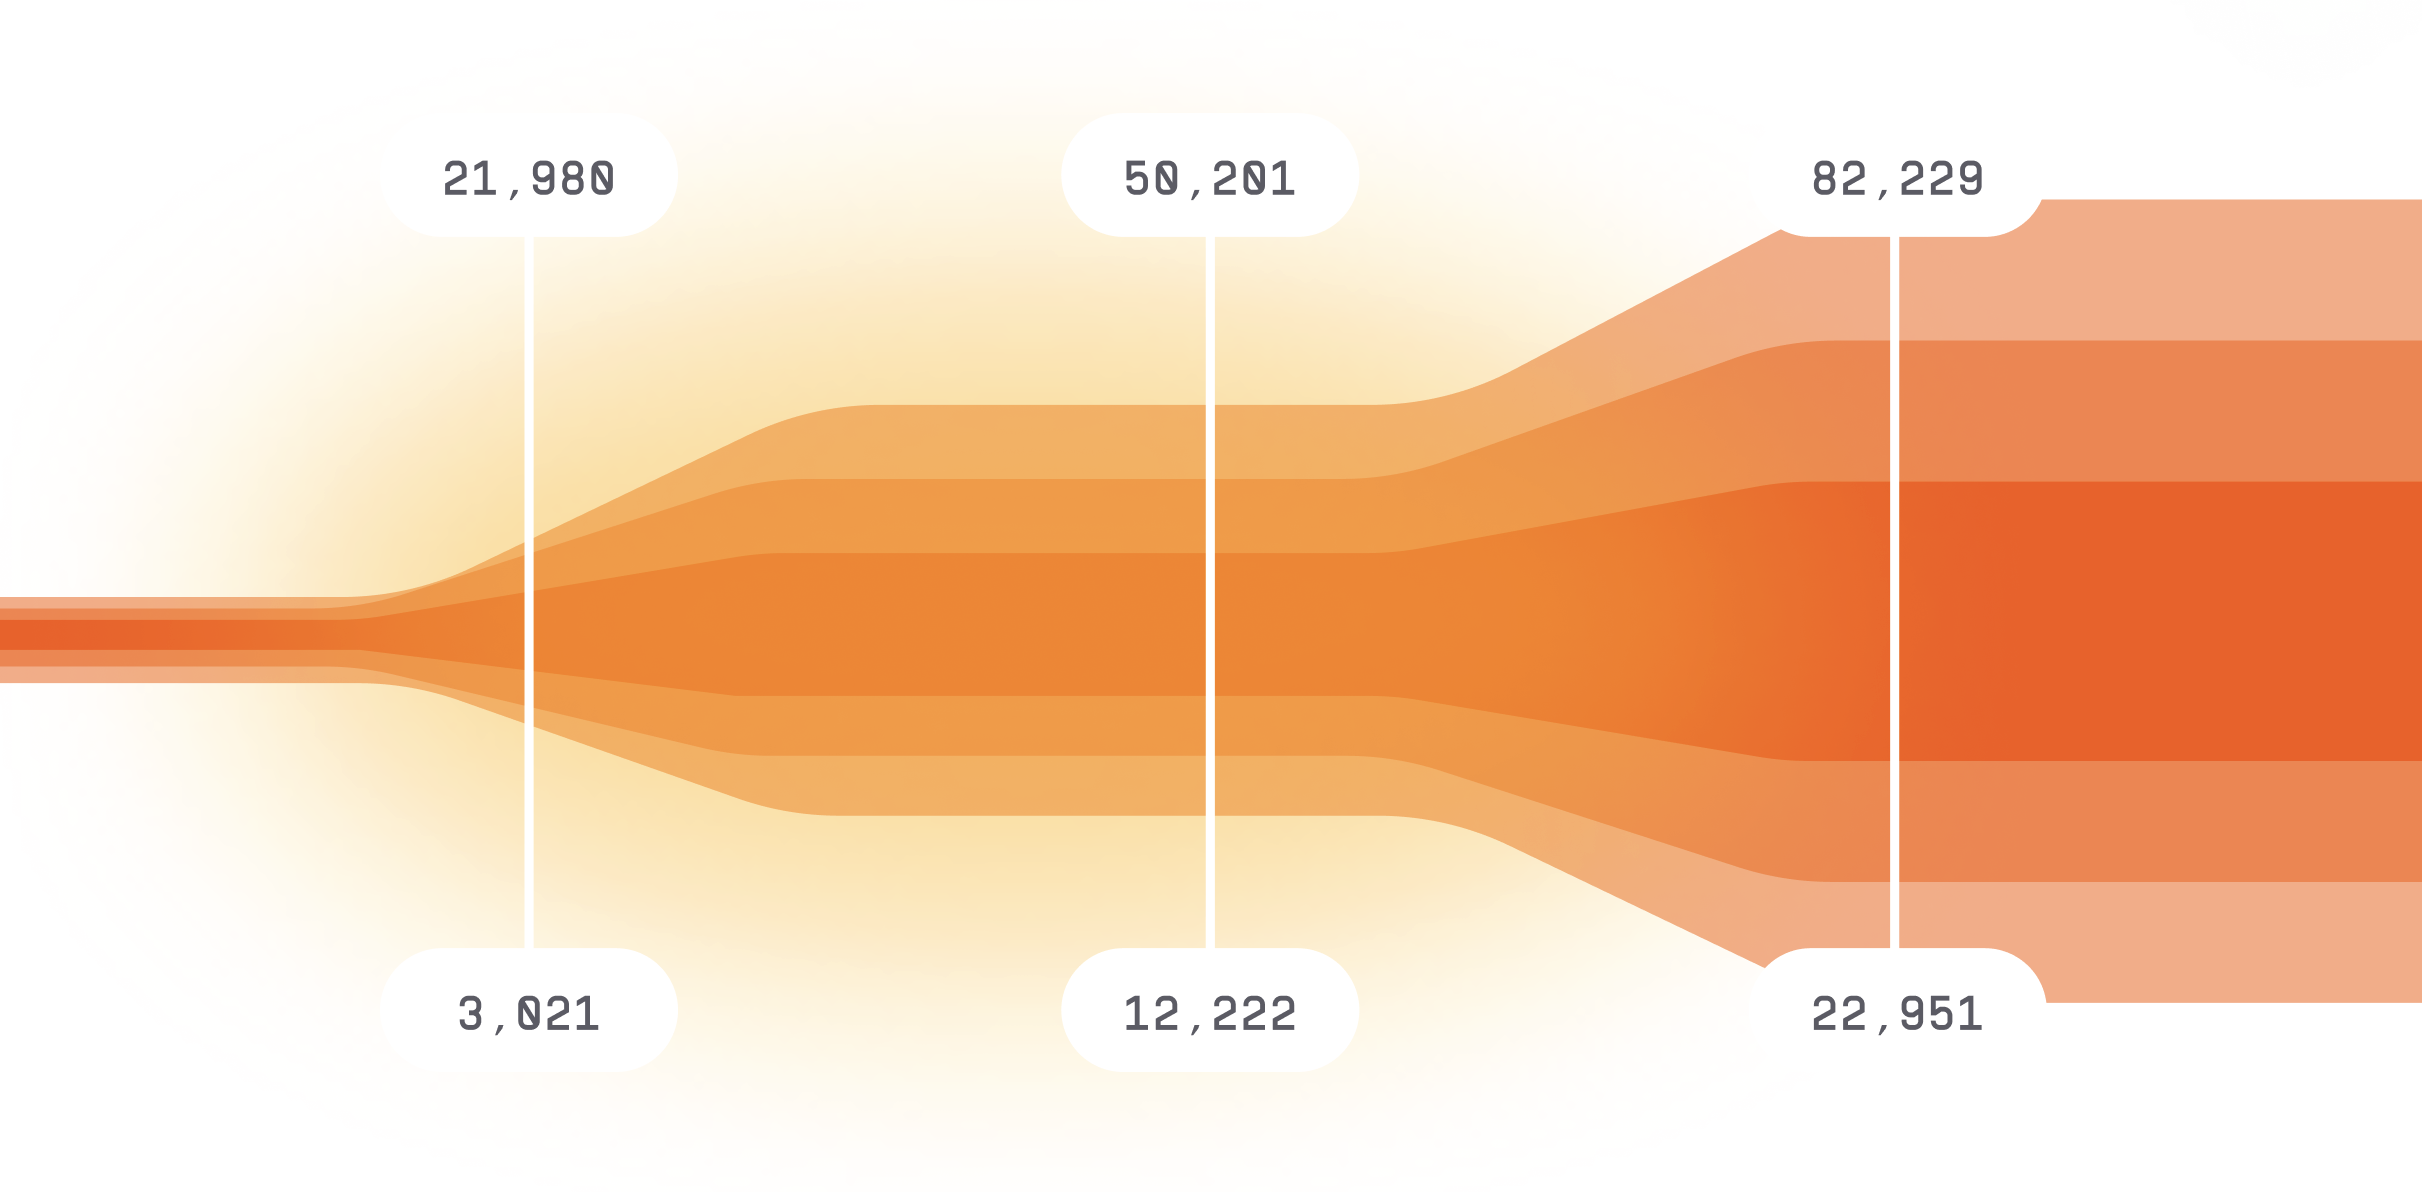
To construct a Funnel Chart, you start with a wide base that represents the initial stage of the process or pipeline.
As you move up the chart, the funnel narrows to represent the later stages, with the final stage represented by a small point.
The width of each section of the funnel is proportional to the number or percentage of leads or customers that move through that stage.
Summary
The Funnel Chart is often used to track the progress of leads or customers through different stages of a sales funnel.
It can help identify areas that need improvement and highlight areas where the process is working effectively.
The chart is commonly used in business and sales to analyze the effectiveness of marketing and sales efforts.
One advantage of the Funnel Chart is that it provides a clear and concise way to track the progress of leads or customers through different stages.
The design of the chart can be customized to include additional data points or to fit specific design requirements.
Additionally, the chart can be interactive, allowing for the exploration of different levels of data.
Overall, the Funnel Chart is a useful tool for visualizing the stages of a process or sales pipeline.
It is easy to construct and interpret, making it a popular choice for data visualization in business and sales.